
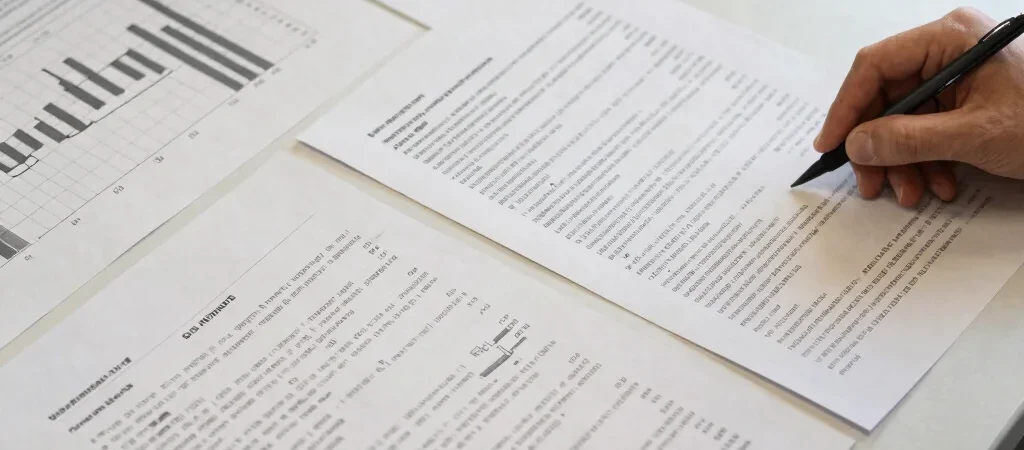
A public figure can look definitive on a chart and still be subject to revision. Counts and estimates are often assembled from records that arrive at different times or are checked after an initial release. When a number changes, readers need the explanation alongside the new value.
Find the source and date
Start with the organization that produced the data and the date the material covers. A release date is not necessarily the same as the period being measured, and a later publication may update an earlier period. Those distinctions can explain why two reports cite different values without either one describing a different event.
Then look for a note about methodology or revision. A figure may be updated when late records are added, duplicate entries are removed, or an estimate is replaced by a more complete count. The reason matters: it tells readers whether the change reflects better information, a changed definition, or something else.
Keep the comparison fair
Comparisons only hold when the figures measure the same thing across the same time frame. A monthly estimate cannot be compared directly with a yearly total, and a revised series may not line up with a headline figure published under an older method. Check the labels before drawing a trend from the numbers.
A revision does not automatically invalidate the original report, but it can change what that report supports. The clearest account identifies the updated figure, describes the reason for the change, and notes what remains uncertain. When reading data-based news, keep the date and definition attached to the number.